Integrating Observability with K8sGPT
Enhance your Kubernetes observability by integrating Prometheus and Grafana with K8sGPT. Follow these steps to set up and visualize your cluster's insights:
Prerequisites
- Prometheus: Install using Helm via Prometheus Community Helm Charts.
- Grafana Dashboard: Ensure Grafana is installed and accessible in your environment.
Installation Steps
Install the K8sGPT Operator with observability features enabled:
helm install release k8sgpt/k8sgpt-operator -n k8sgpt-operator-system --create-namespace --set interplex.enabled=true --set grafanaDashboard.enabled=true --set serviceMonitor.enabled=true
This command: - Creates a ServiceMonitor to integrate with Prometheus. - Automatically configures and populates data into your Grafana dashboard.
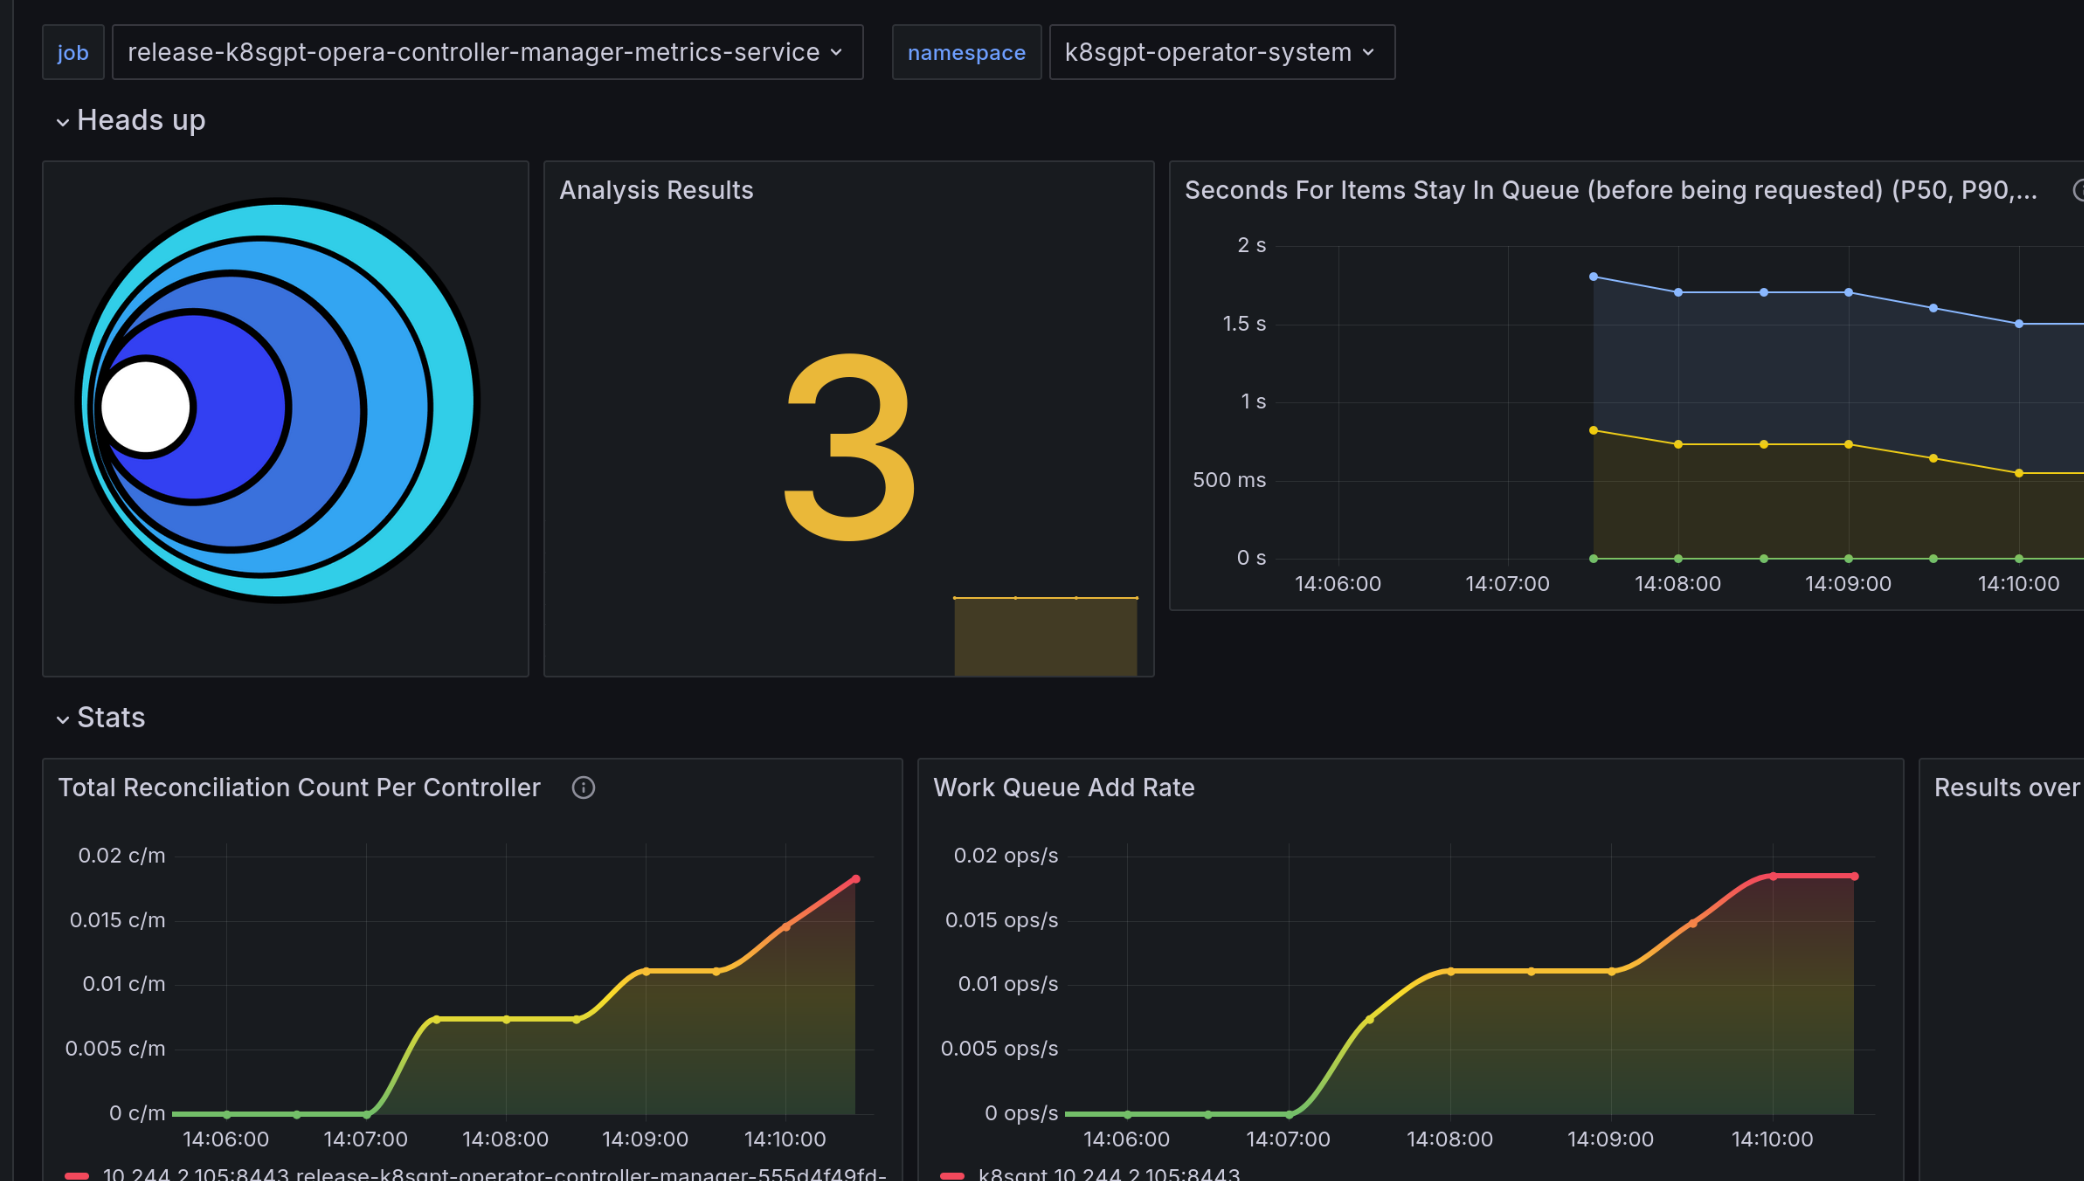
Once set up, you can explore key metrics like: - Results identified by K8sGPT. - Operator workload details, providing insight into resource usage and efficiency.
See example of a K8sGPT Grafana dashboard
