K8sGPT Operator
K8sGPT can run as a Kubernetes Operator inside the cluster. The scan results are provided as Kubernetes YAML manifests.
This section will only detail how to configure the operator. For installation instructions, please see the getting-started section.
Architecture
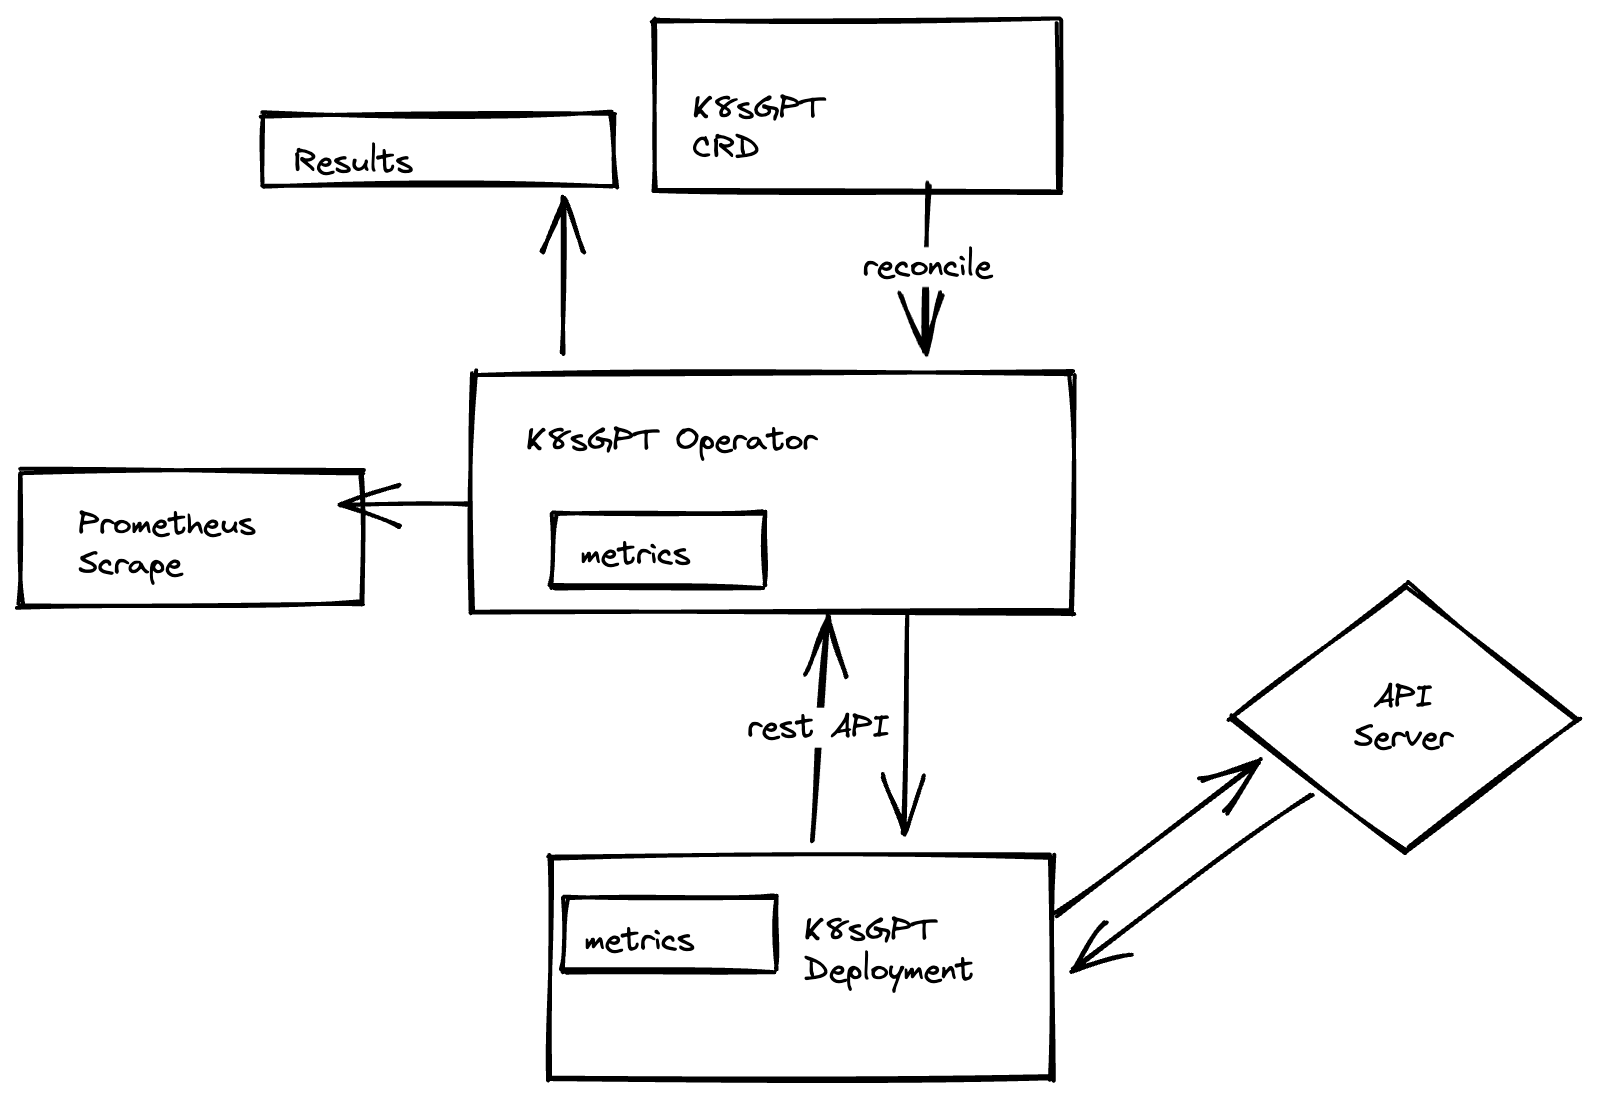
The diagram below showcases the different components that the K8sGPT Operator installs and manages:

Customising the Operator
As with other Helm Charts, the K8sGPT Operator can be customised by modifying the values.yaml file.
The following fields can be customised in the Helm Chart Deployment:
| Parameter | Description | Default |
|---|---|---|
serviceMonitor.enabled |
false |
|
serviceMonitor.additionalLabels |
{} |
|
grafanaDashboard.enabled |
false |
|
grafanaDashboard.folder.annotation |
"grafana_folder" |
|
grafanaDashboard.folder.name |
"ai" |
|
grafanaDashboard.label.key |
"grafana_dashboard" |
|
grafanaDashboard.label.value |
"1" |
|
controllerManager.kubeRbacProxy.containerSecurityContext.allowPrivilegeEscalation |
false |
|
controllerManager.kubeRbacProxy.containerSecurityContext.capabilities.drop |
["ALL"] |
|
controllerManager.kubeRbacProxy.image.repository |
"gcr.io/kubebuilder/kube-rbac-proxy" |
|
controllerManager.kubeRbacProxy.image.tag |
"v0.0.19" |
|
controllerManager.kubeRbacProxy.resources.limits.cpu |
"500m" |
|
controllerManager.kubeRbacProxy.resources.limits.memory |
"128Mi" |
|
controllerManager.kubeRbacProxy.resources.requests.cpu |
"5m" |
|
controllerManager.kubeRbacProxy.resources.requests.memory |
"64Mi" |
|
controllerManager.manager.sinkWebhookTimeout |
"30s" |
|
controllerManager.manager.containerSecurityContext.allowPrivilegeEscalation |
false |
|
controllerManager.manager.containerSecurityContext.capabilities.drop |
["ALL"] |
|
controllerManager.manager.image.repository |
"ghcr.io/k8sgpt-ai/k8sgpt-operator" |
|
controllerManager.manager.image.tag |
"v0.0.19" |
|
controllerManager.manager.resources.limits.cpu |
"500m" |
|
controllerManager.manager.resources.limits.memory |
"128Mi" |
|
controllerManager.manager.resources.requests.cpu |
"10m" |
|
controllerManager.manager.resources.requests.memory |
"64Mi" |
|
controllerManager.replicas |
1 |
|
kubernetesClusterDomain |
"cluster.local" |
|
metricsService.ports |
[{"name": "https", "port": 8443, "protocol": "TCP", "targetPort": "https"}] |
|
metricsService.type |
"ClusterIP" |
For example: In-cluster metrics
It is possible to enable metrics of the operator so that they can be scraped through Prometheus.
This is the configuration required in the values.yaml manifest:
serviceMonitor:
  enabled: true
The new values.yaml manifest can then be provided upon installing the Operator inside the cluster:
helm update --install release k8sgpt/k8sgpt-operator --values values.yaml